What Is OPS in Baseball? A Plain-English Guide
What is OPS in baseball? See how on-base percentage plus slugging creates one number, then follow a worked example and learn what OPS misses.

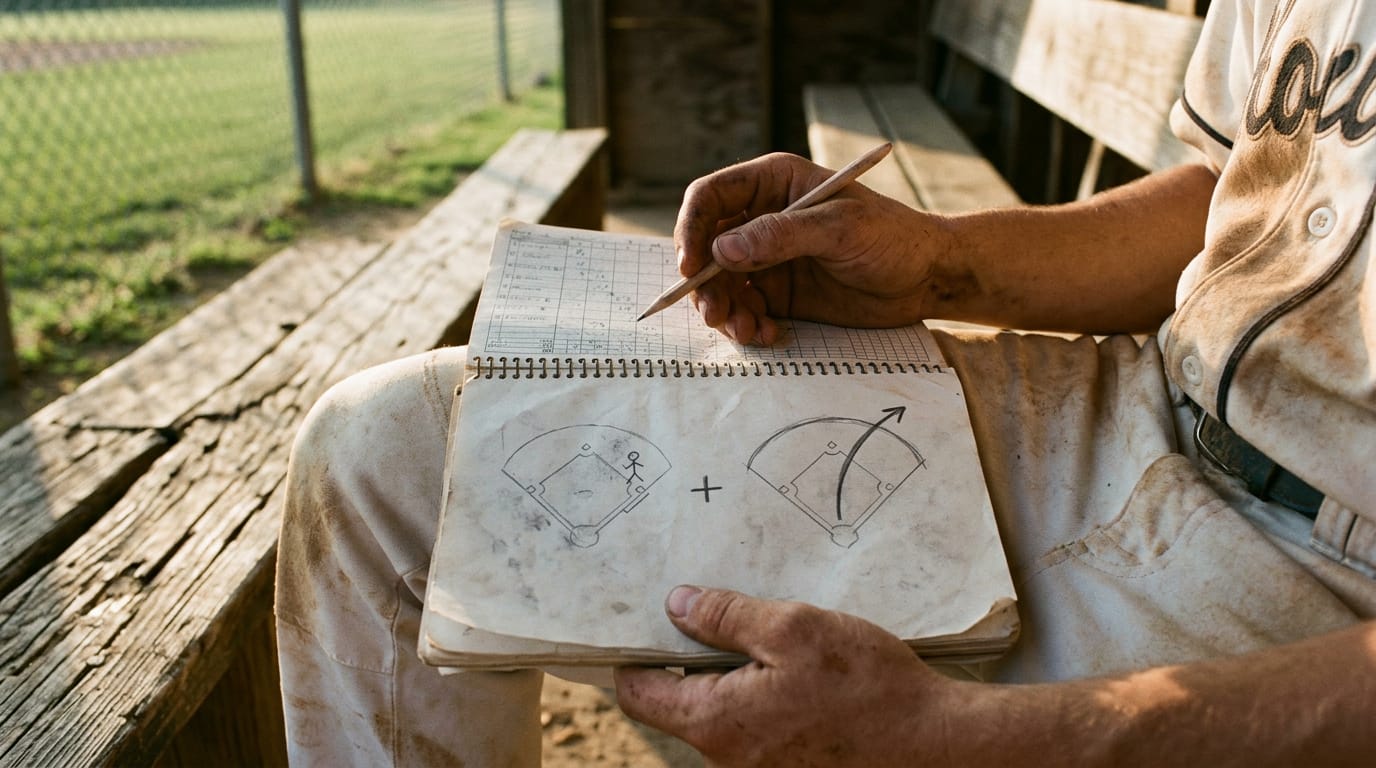
Ask a parent what makes a good hitter and you’ll hear things like “he gets on base” or “she hits the ball hard.” OPS squeezes both ideas into one number.
Here’s the plain version: OPS stands for on-base plus slugging. It adds a batter’s on-base percentage (how often they reach base) to their slugging percentage (total bases earned per at-bat).
We’ll cover the formula, a worked calculation, benchmarks and limits, and what to check when you’re shopping for bats and gear.
What Is OPS in Baseball
You’ll see OPS on plenty of batting stat lines, and it’s one of the quickest ways to size up a hitter. It’s easier to work out than its name suggests, and we’ll show you how.
What OPS means and how it’s totaled
OPS stands for on-base plus slugging, and you get it by adding on-base percentage (OBP) and slugging percentage (SLG). Once you know those two parts, the abbreviation is easy to decode.
Say, for illustration, a batter posts a .360 OBP and a .450 SLG. Add them together (.360 + .450) and the OPS is .810.
How on-base and slugging percentages work
On-base percentage answers how often a batter reaches base. Hits, walks, and times hit by a pitch all count toward it, so a hitter who draws free passes gets credit just like one who lines a single.
Slugging percentage answers a different question: how many total bases a batter earns per at-bat. A single counts as one base, a double as two, a triple as three, and a home run as four.
Think of a 12-year-old who draws plenty of walks but rarely hits for power. A coach or parent comparing that kid to a teammate can weigh both skills in one number at a glance. Two skills, one number.
Where OPS came from and its purpose
According to Baseball Prospectus, OPS became popular as a measure of offensive production in the 1980s. In 1984, The Hidden Game of Baseball by John Thorn, Pete Palmer, and David Reuther helped popularize it as a fuller measure of offensive performance.
Its purpose is a more complete view of offense, reading getting on base and power together rather than apart. Topps has printed OPS on its baseball cards since 2004.
Reading OPS and Its Limits
OPS is handy, but no single number tells the whole story. Here’s how to read it fairly.
Where OPS can mislead you
OPS (on-base plus slugging) adds on-base percentage (OBP) to slugging percentage (SLG), weighting them equally.
According to the Sabermetrics Library, many sabermetricians (baseball statisticians) dislike that, because on-base percentage is roughly twice as important as slugging for producing runs (about 1.8 times).
That doesn’t make OPS useless. It’s easy to find and still informative, so treat it as a starting point, not a final verdict. Track your league’s OPS, too, since a strong number means more once you know what the rest of the league is posting.
Is a .850 OPS good?
Yes, a .850 OPS is very good. Here’s the rough scale:
- Near 1.000: excellent
- .800 and up: very good
NBC Sports reported that the 2023 average across Major League Baseball (MLB) was .734, so .850 sits well above it. Benchmarks differ by league level, so treat these major-league numbers as a yardstick, not a rulebook.
OPS works at youth and amateur levels too, but judge a strong number against that level’s own hitters.
How OPS+ adjusts for ballparks and leagues
OPS+ adjusts OPS for the league and ballpark a hitter played in. Its scale centers on 100, which equals league average, so 125 means 25% better than average.
Think of a parent comparing two hitters from different leagues, one in a hitter-friendly park and one in a pitcher-friendly park.
Raw OPS can make the first look better, but OPS+ evens the field, so you’re comparing skill rather than scenery. Context matters most.
Real OPS Examples from Top Hitters
A handful of hitters and one memorable team show what a great OPS really looks like. Here’s who sits at the top.
Who has the top OPS, past and present?
Babe Ruth holds the career OPS record, the benchmark every hitter gets measured against. Mike Trout ranks as the top active player, so he’s the name to check when you’re comparing today’s sluggers.
According to MLB.com’s roundup of big seasons after the World Baseball Classic, Shohei Ohtani posted a 1.066 OPS in 2023, the best mark in the majors that year.
So who currently has the highest OPS in baseball? The current-season leader changes with every game, so check a live leaderboard on a stats site for the latest name. Early in the year, a few hot weeks can reshuffle the top of that list fast.
For your kid’s league, these names are the outliers, not the yardstick.
The 2023 Braves offense by the numbers
The 2023 Braves posted a team OPS of .844, the top mark among expansion-era teams (the stretch since the league started adding new franchises).
Their slugging was record-level, but their on-base percentage (OBP) ran lower. The power did the heavy lifting more than patience did.
Consider a travel-team coach filling out a lineup card. One kid smacks doubles but strikes out often, while another draws walks and rarely chases bad pitches. Checking both halves of OPS shows which one actually helps the team score.
Whether that makes it the best offense in history is still up for debate. Fans and analysts argue over eras, ballparks and competition, and one number won’t settle it.
How Stats Fit into Betting Decisions
Numbers sharpen a betting decision only when you know what they measure. Here’s where they help and where they mislead.
Where stats help with MLB odds
Metrics like OPS (on-base plus slugging) help shape the odds on Major League Baseball (MLB) games. Consider a fan backing a team’s offense late in the season.
Checking its hitters’ recent OPS tells that fan more than a season-old batting average, and shows whether the odds reflect current form. A stat tells you what happened, not what will happen next. A number is a clue, not a verdict.
An award market asks who wins a season honor. Three common examples:
- Most Valuable Player (MVP): OPS shows who has been producing the most at the plate, a useful starting point.
- Rookie of the Year (ROY): A first-year hitter’s OPS shows how well he or she is handling major league pitching, but a short early stretch can swing the number. Check the sample size (how many at-bats a number covers) before you trust it.
- Cy Young Award: It goes to each league’s best pitcher. OPS measures hitting, so you’ll want pitching stats to judge this one.
Betting apps and broadcasts throw around terms that sound like a second language. Before you wager, make sure you can explain each one in plain words.
Consider a new fan who sees a stat on an app, assumes it matches batting average, and bets on the wrong number. A quick look at the definition would have prevented that. Know the term before you bet on it.
Other Baseball Stats Worth Knowing
Several common abbreviations show up alongside OPS: ERA (earned run average), WHIP (walks plus hits per inning pitched), and WAR (wins above replacement).
How WHIP tracks walks and hits allowed
According to Offensive Explosion, WHIP represents the walks and hits per inning pitched. It’s a measure of traffic on the bases rather than runs.
The 2023 league-average WHIP was 1.315, so a pitcher well under that mark is limiting baserunners. Think of a coach scanning a playoff stat sheet. A low WHIP flags the pitcher hardest to get runners on, so she knows whom to plan around.
WHIP ignores runs and how outs are made, so pair it with other numbers. Career and reliever leaderboards help you compare pitchers in different roles.
How WAR measures wins above replacement
WAR estimates how many wins a player adds over a replacement-level fill-in, measuring total value rather than one skill. Voters and fans often bring it up in Hall of Fame and MVP debates.
Two versions of WAR, bWAR and fWAR, often differ for the same player, so check which one a source uses before you compare.
On defense, Defensive Runs Saved (DRS) and Ultimate Zone Rating (UZR) estimate fielding value differently, so they won’t always agree. Fielding independent pitching (FIP) aims to isolate what a pitcher controls, while runs allowed counts every run.
ERA and the variants that tweak it
ERA shows earned runs allowed per nine innings, not all runs. Runs that score on a defensive error don’t count as earned, so a fielder’s mistake doesn’t hurt the pitcher’s ERA. An ERA under 3.00 is elite.
ERA+ adjusts for ballpark and league, while xERA (expected ERA) estimates what ERA should have been based on the quality of contact allowed.
So the next time someone calls a hitter good, ask about on-base ability and power together. OPS rolls both into one number, a useful first look rather than the final word.
Bring that same habit to your shopping. Check how a bat or piece of gear fits the player who’ll use it this season, not the one you hope they’ll become.
The best bat is the one that fits the hitter, and the best stat is the one that helps you see that hitter clearly.
References
- Estimating Situational Effects on OPS — doi.org (2008)
- Offensive Explosion: An Analysis of Trends in Hitting Production in Major League Baseball — repository.usfca.edu (2017)
- Mike Trout’s case among baseball’s all-time greats — nbcsports.com (2026)
- MLB players with big seasons after World Baseball Classic — mlb.com (2026)
- OPS and OPS+ — library.fangraphs.com
- Prospectus Feature: OPS and wOBA, Briefly Revisited — baseballprospectus.com (2018)
Questions
What is the definition of OPS?
OPS stands for on-base plus slugging. It is calculated by adding a batter’s on-base percentage (OBP) to their slugging percentage (SLG).
What are some common abbreviations used in baseball?
Common baseball abbreviations include OPS (on-base plus slugging), OBP (on-base percentage), SLG (slugging percentage), ERA (earned run average), WHIP (walks plus hits per inning pitched), and WAR (wins above replacement). Other examples include RBI (runs batted in), HR (home run), and BB (base on balls, or walk).
Who currently has the highest OPS in baseball?
The current-season OPS leader changes as games are played, so check a live MLB statistics leaderboard for the latest name. Mike Trout is noted as a top active player, but that is not necessarily the same as leading the current season.
Is a 850 OPS good?
Yes, an .850 OPS is very good. It is well above the cited 2023 MLB average of .734, though benchmarks vary by league and level.
Sources
- Estimating Situational Effects on OPS, doi.org,
- Prospectus Feature: OPS and wOBA, Briefly Revisited | Baseball Prospectus, baseballprospectus.com,
- OPS and OPS+ | Sabermetrics Library, library.fangraphs.com
- Mike Trout's case among baseball's all-time greats - NBC Sports, nbcsports.com,
- MLB players with big seasons after World Baseball Classic, mlb.com,
- Offensive Explosion: An Analysis of Trends in Hitting Production in Major League Baseball, repository.usfca.edu,
Find your level
The Counter